
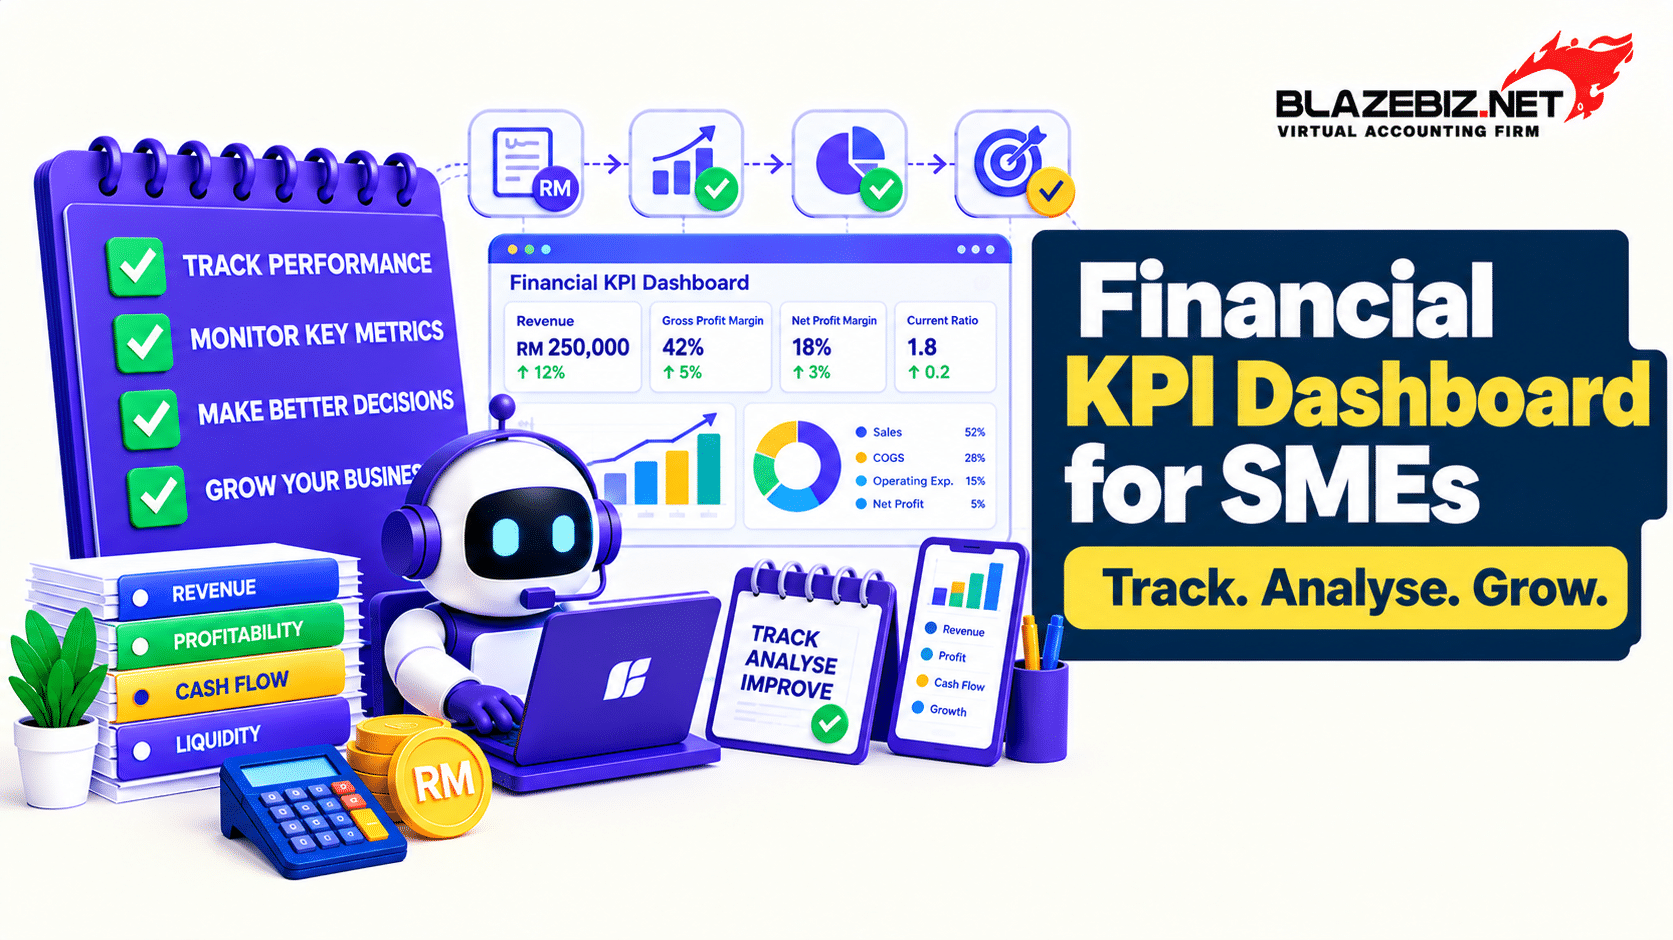
Running a business involves more than checking sales and looking at the bank balance. Malaysian small and medium-sized enterprises (SMEs) also need to understand whether their business is profitable, whether customers are paying on time and whether expenses are growing faster than revenue.
A financial KPI dashboard brings important business performance indicators together in one place. Instead of reviewing multiple reports separately, business owners can use a focused dashboard to identify changes, investigate potential problems and make informed decisions.
In this guide, we explain what a financial KPI dashboard is, which metrics Malaysian SMEs should monitor, how to calculate key indicators and how accounting software can support more consistent financial reporting.
What Is a Financial KPI Dashboard?
A financial KPI dashboard is a summary of selected financial measurements used to monitor business performance against targets or previous results. KPI stands for Key Performance Indicator.
For example, a dashboard might show monthly revenue, gross profit margin, operating expenses, cash balance and overdue customer invoices. These figures help business owners understand different aspects of financial performance without having to examine every transaction individually.
A useful dashboard does not need to contain dozens of metrics. Start with a small set of indicators that relate directly to your business goals, then expand it when additional information becomes necessary.
Why Do Malaysian SMEs Need a Financial KPI Dashboard?
Without regular performance monitoring, business owners may only discover financial problems after they have started affecting daily operations. Sales might increase while profit margins decline, or reported revenue might look healthy while customer payments remain overdue.
A financial KPI dashboard can help your business:
- Monitor sales performance: Compare actual revenue with monthly targets and previous periods.
- Measure profitability: Understand whether sales are generating sufficient gross and net profit.
- Monitor cash flow: Review available cash alongside expected receipts and upcoming payments.
- Improve payment collection: Identify overdue invoices and rising customer balances.
- Control expenses: Detect cost increases and investigate budget variances.
- Support planning: Use consistent financial information to guide pricing, staffing and investment decisions.
8 Financial KPIs Malaysian SMEs Should Track
The right KPIs depend on your business model. A retailer may need to monitor inventory and gross profit by product, while a service business may focus more on operating costs, project profitability and customer collections.
1. Monthly Revenue
Monthly revenue measures the sales your business generates during a particular period. Tracking revenue over time helps you identify growth patterns, seasonal changes and potential sales problems.
Compare actual revenue with your monthly target and previous periods. Where possible, separate results by product, service, branch or sales channel to understand what is driving changes.
Revenue Growth Formula:
Revenue Growth (%) = (Current Period Revenue − Previous Period Revenue) ÷ Previous Period Revenue × 100%
For example, if monthly revenue increases from RM50,000 to RM60,000, revenue growth is 20%. This indicates higher sales, but you should also examine costs and collections to understand whether the increase benefits your business financially.
2. Gross Profit Margin
Gross profit margin shows how much of your sales revenue remains after deducting the cost of goods sold or relevant direct costs. It helps you assess product pricing, purchasing costs and the profitability of your sales.
Gross Profit Margin Formula:
Gross Profit Margin (%) = (Revenue − Cost of Goods Sold) ÷ Revenue × 100%
Suppose your business generates RM60,000 in revenue and incurs RM36,000 in direct product costs. Gross profit is RM24,000, giving you a gross profit margin of 40%.
If revenue increases but gross profit margin declines, investigate supplier price changes, discounts, product mix and other direct costs. Read our guide on inventory management for Malaysian SMEs for more information about managing stock and inventory costs.
3. Net Profit Margin
Net profit margin measures how much net profit your business earns relative to its revenue after accounting for relevant expenses. It provides a broader view of profitability than gross profit margin.
Net Profit Margin Formula:
Net Profit Margin (%) = Net Profit ÷ Revenue × 100%
For example, if your business generates RM100,000 in revenue and records RM8,000 in net profit, your net profit margin is 8%.
Monitor this metric alongside operating expenses and gross profit margin. If gross margin remains stable but net margin falls, operating expenses, finance costs or other charges may be increasing.
4. Operating Expenses as a Percentage of Revenue
This KPI measures how much of your revenue is used to cover operating expenses. Depending on your business, these expenses may include salaries, rent, utilities, marketing, administration and software subscriptions.
Operating Expense Ratio Formula:
Operating Expense Ratio (%) = Operating Expenses ÷ Revenue × 100%
If your operating expenses are RM15,000 and revenue is RM60,000, the operating expense ratio is 25%.
Compare the ratio over time and investigate significant changes. An increase is not always negative, as additional spending may support planned growth, but it should be understood and justified.
5. Cash Balance and Cash Flow
Your cash balance shows how much cash is available at a particular point in time. Cash flow measures the movement of money into and out of the business over a period.
Monitoring both is important because a profitable business can still face payment difficulties if customer collections arrive after major expenses are due.
Review your reconciled bank balances, expected customer receipts, upcoming supplier payments, payroll and other commitments. A cash balance on its own does not show whether future payments can be met comfortably.
For a more forward-looking view, read our guide to cash flow forecasting for Malaysian SMEs.
6. Accounts Receivable and Overdue Invoices
Accounts receivable represents amounts customers owe your business for credit sales. Tracking outstanding invoices helps you understand how much revenue has not yet been collected.
Useful measures include total outstanding receivables, the amount overdue and the age of unpaid invoices. You can group overdue balances by how long they have remained unpaid, such as 1–30 days, 31–60 days and more than 60 days past due.
For businesses with consistent credit sales, days sales outstanding (DSO) can provide an additional measure of collection speed.
Basic DSO Estimate:
DSO (Days) = Average Accounts Receivable ÷ Credit Sales for the Period × Number of Days in the Period
Use consistent definitions and a suitable period when calculating DSO. A rising figure may indicate slower collections, changes in customer payment terms or a shift in sales mix.
Learn practical ways to improve collection visibility in our guide to tracking outstanding customer payments effectively.
7. Accounts Payable and Upcoming Supplier Payments
Accounts payable represents amounts your business owes suppliers for purchases and services. Monitoring supplier balances and due dates helps you plan payments, maintain supplier relationships and anticipate cash requirements.
Review total amounts payable, overdue supplier invoices and payments due in the coming weeks. Consider these obligations alongside expected customer collections and available cash.
Do not treat all unpaid invoices as overdue. Separate amounts that are not yet due from those that have passed their agreed payment dates.
For more guidance, read our article on accounts payable management in Malaysia.
8. Budget Variance
Budget variance measures the difference between your planned financial results and actual performance. It helps you identify areas where revenue, costs or cash movements differ from expectations.
Budget Variance Formula:
Budget Variance = Actual Amount − Budgeted Amount
For example, if your monthly marketing budget is RM3,000 but actual spending is RM3,600, the expense variance is RM600 above budget.
An unfavourable variance is not automatically a sign of poor performance. Additional spending may be justified if it supports an approved campaign or business expansion. Investigate the reason and compare the cost with the outcome achieved.
How to Build a Simple Financial KPI Dashboard
You do not need a complicated business intelligence system to get started. A spreadsheet or accounting system report can provide a useful first dashboard if the data is accurate and the metrics are clearly defined.
Step 1: Define Your Business Goals
Decide what you want to improve. Your priorities might include increasing gross profit margin, reducing overdue invoices, controlling expenses or maintaining a healthier cash position.
Step 2: Select the Most Relevant KPIs
Start with approximately six to eight meaningful indicators rather than trying to track everything. Choose metrics that help you make decisions and that can be calculated consistently from available records.
Step 3: Set Targets and Review Thresholds
Establish a target or acceptable range for each KPI based on your business plan, past results and operating requirements. A retailer and a professional services firm may need different margin targets, so avoid adopting arbitrary benchmarks without context.
Define when a result should trigger further investigation. For example, you might review any significant decline in gross margin or any material increase in overdue receivables.
Step 4: Use Consistent Data Sources
Use reliable accounting reports, bank records, invoice schedules and approved budgets. Define each metric clearly so that the same calculation is used from one month to the next.
For example, decide whether revenue is measured based on recognised sales or cash collected. These figures answer different questions and should not be mixed in the same KPI calculation.
Step 5: Assign Responsibility and Take Action
Each important KPI should have someone responsible for reviewing it. When a figure moves outside the expected range, record the reason, the action required and when the result will be reviewed again.
A dashboard is useful only when its information leads to better decisions. Simply displaying numbers without investigating changes is unlikely to improve performance.
Example: Monthly Financial KPI Dashboard for an SME
The table below shows a simplified example of how a Malaysian SME might review selected financial indicators. These figures are illustrative, not recommended targets for every business.
| KPI | Target | Actual | Review Action |
|---|---|---|---|
| Monthly revenue | RM60,000 | RM55,000 | Review sales performance and pipeline |
| Gross profit margin | 40% | 36% | Check product costs and discounts |
| Operating expenses | RM15,000 | RM16,200 | Investigate cost increases |
| Overdue receivables | Below RM8,000 | RM12,000 | Prioritise overdue customer follow-ups |
| Closing cash balance | At least RM20,000 | RM18,000 | Review near-term cash requirements |
| Marketing expense variance | Within approved budget | RM600 over budget | Check spending and campaign results |
This dashboard highlights several areas for investigation: revenue is below target, gross margin is lower than expected, operating expenses are higher and overdue receivables have increased.
The business should investigate the causes rather than assuming that one figure explains the entire situation. For example, a marketing overspend may be related to a campaign that has not yet generated sales, while lower gross margin may reflect increased supplier costs or heavier discounts.
The cash balance should also be reviewed alongside expected receipts and payments. A target cash balance is useful only when it reflects the business’s actual operating needs and upcoming commitments.
Common Financial KPI Dashboard Mistakes to Avoid
A dashboard can create confusion if it contains too much information or relies on inconsistent data. Avoid these common mistakes:
- Tracking too many KPIs: Focus on the indicators that support your most important business decisions.
- Using inaccurate records: Reconcile bank transactions and review accounting records before relying on the figures.
- Mixing different definitions: Keep revenue, profit and cash measurements clearly separated.
- Ignoring trends: Compare current results with previous periods and relevant targets.
- Setting unrealistic targets: Base targets on business circumstances, historical results and practical operating requirements.
- Failing to act: Assign responsibility for investigating significant changes and following up on corrective actions.
How Accounting Software Can Support KPI Monitoring
Preparing a financial dashboard manually can become time-consuming as a business handles more invoices, purchases, bank transactions and operating expenses. Multiple spreadsheets can also introduce inconsistencies when figures are updated at different times.
Accounting software can help centralise transaction records, track customer and supplier balances, and generate reports for financial analysis. Depending on the system and its configuration, these reports can provide useful inputs for revenue, expense, profitability and working capital KPIs.
For Malaysian SMEs, SQL Accounting can support day-to-day accounting and financial reporting workflows. Confirm which reports and features are available in your setup and ensure that the underlying records are maintained accurately.
Businesses should also review how their sales, inventory and other operational systems connect with accounting records. Reliable and consistent information makes it easier to understand performance across different areas of the business.
Automation can reduce manual reporting work, but it does not replace the need to define KPIs correctly, check unusual results and make informed management decisions.
Frequently Asked Questions
1. What is a financial KPI dashboard?
A financial KPI dashboard summarises selected financial indicators, such as revenue, profit margins, cash flow and outstanding invoices. It helps business owners monitor performance and identify areas that may need attention.
2. Which financial KPIs should Malaysian SMEs track?
Useful starting points include monthly revenue, gross profit margin, net profit margin, operating expenses, cash balance, accounts receivable, accounts payable and budget variance. Choose metrics that match your business model and goals.
3. How often should a financial KPI dashboard be updated?
Many SMEs benefit from reviewing their main financial KPIs monthly. Cash flow, overdue invoices and other time-sensitive measures may need weekly or more frequent monitoring, depending on the business’s circumstances.
4. Can I create a financial KPI dashboard in Excel?
Yes. Excel or another spreadsheet tool can be suitable for a simple dashboard. Use consistent formulas, reliable data sources and a regular update process. As transaction volumes increase, accounting software may help reduce manual work.
5. What is the difference between a KPI and a financial report?
A financial report provides detailed information about transactions, financial position or business performance. A KPI is a specific measurement selected to monitor progress towards a goal or identify a condition that requires action. Financial reports often provide the data used to calculate KPIs.
6. Does a higher revenue KPI always mean the business is performing better?
No. Revenue can increase while gross profit margin declines, expenses rise or customer payments slow down. Review revenue alongside profitability, cash flow and outstanding balances to understand the broader financial picture.
Final Thoughts
A financial KPI dashboard helps Malaysian SMEs move beyond checking sales alone and develop a clearer view of business performance. By monitoring revenue, profitability, expenses, cash flow and customer payments, you can identify changes earlier and make more informed decisions.
Start with a small set of meaningful KPIs, use consistent and accurate records, and review the results regularly. Most importantly, connect each important finding to a practical action that supports your business goals.
Looking to improve your accounting and financial reporting processes? Explore BlazeBiz to learn more about accounting solutions for Malaysian businesses.
